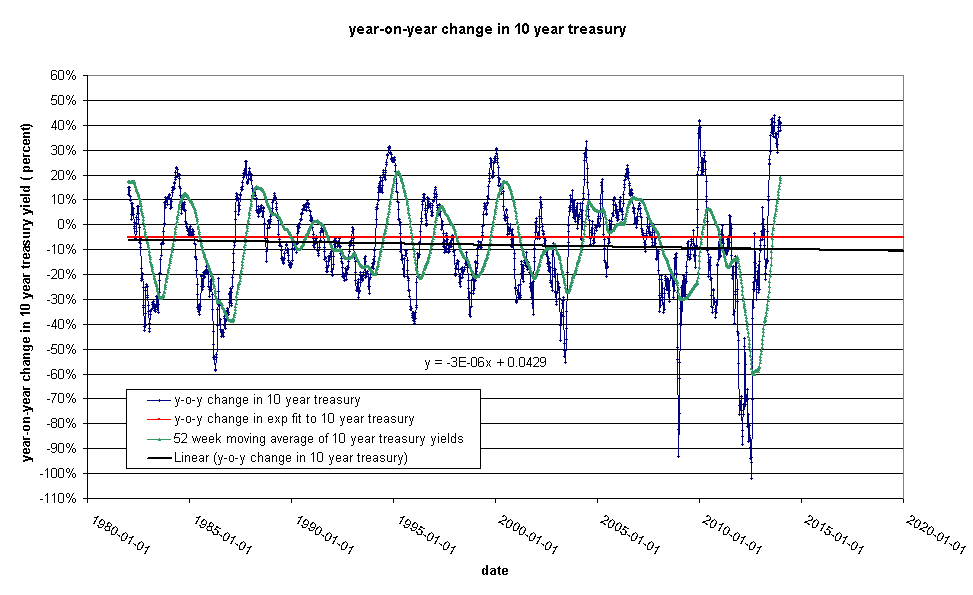
This is a fairly busy chart showing the relationship I talked about on 2013-12-29:

The 10 year US treasury yield is dropping at a relatively fixed rate every year. The target percentage drop is 5%/year. This requires a little interpretation. If the yield on Jan 1 is 4% a 5% drop would take you to 3.8% on Dec 31. Note that the fitted line shows that the fed is not keeping to the 5%/year plan. We are currently flirting with 10%/year and the fluctuations ( as I previously discussed) are getting bigger.