You are probably asking yourself, " Arlequin, Why would you review your Nobel Prize winning work on the 10 year treasury bond? Haven't you already said everything there is to say about it?". I need you to forget everything I said about the 10 year bond. This is a new and Ahem... correct... analysis of the US treasury market.
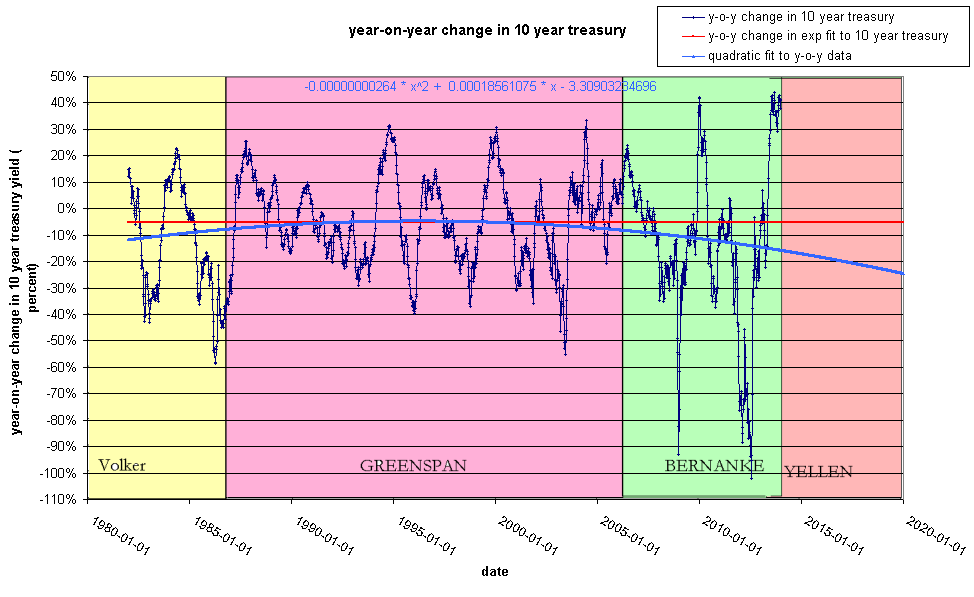
This is a the same chart I showed on 2014-01-08 but I have added a quadratic fit to the data and highlighted the Federal reserve chairman that was in power during each period.

What we see here is that each Fed chairman had a characteristic policy with regards to treasury yields. Volker reduced them aggressively, Greenspan reduced them gradually and Bernanke has been the most aggressive in accelerating the downward trend in yields.
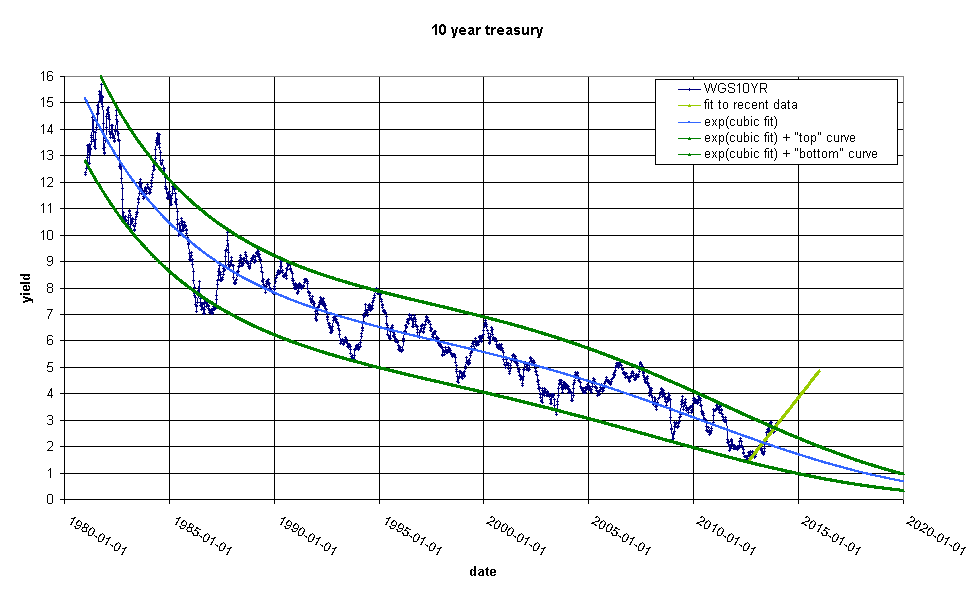
What would the blue curve look like on the simple time series chart? Mathematically this is a little complex, but the answer is here:

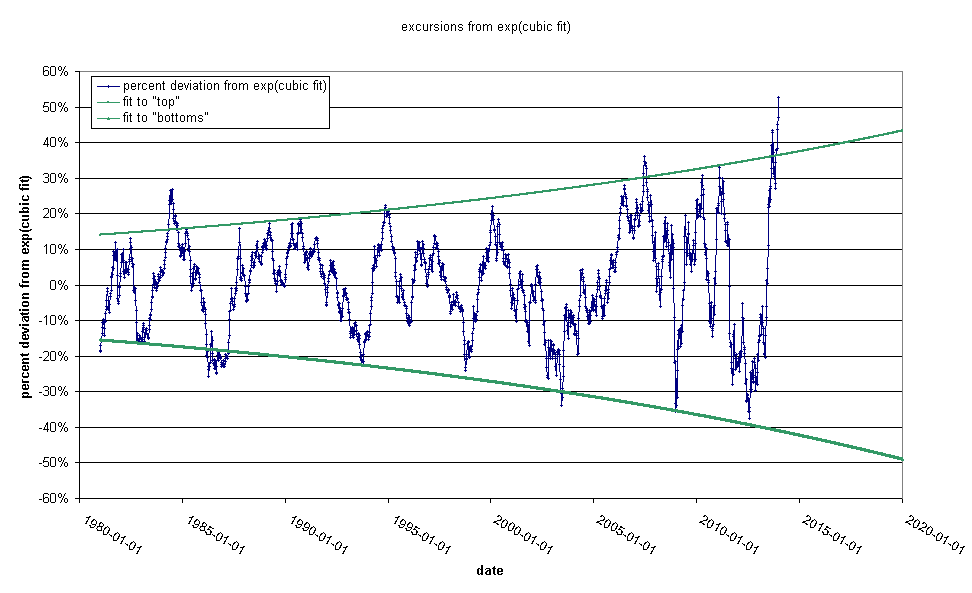
constructing the blue line immediately demands what the deviation chart would look like:

note that in contrast to my chart on on 2013-12-29 we have already long passed the point at which the Fed has generally intervened in the bond markets in the past and we are sailing upwards to the magic 70% crisis level. Note that although the Fed target has been exceeded before, it has never been by so much. I expect a violent downdraft in rates soon.
This post represents a departure for me. I generally try to make
charts that embody simple, obvious mathematical relationships that
are intuitively appealing. This is a bit more complex. I am doing
this because I think that the Fed target rate for interest rates is
not widely understood outside of the Wall-Street community. Far
from being an original observation of mine, I think this result is
generally understood by stock brokers. "Everybody" knows that
we are at crisis levels and "everybody" is expecting a slam down.
If it doesn't come soon, Yellen will lose all
credibility.