The Dow/Gold Ratio
Today we are going to do the Dow/Gold ratio. It is a technique
for abstracting out the currency you are using to find true value.
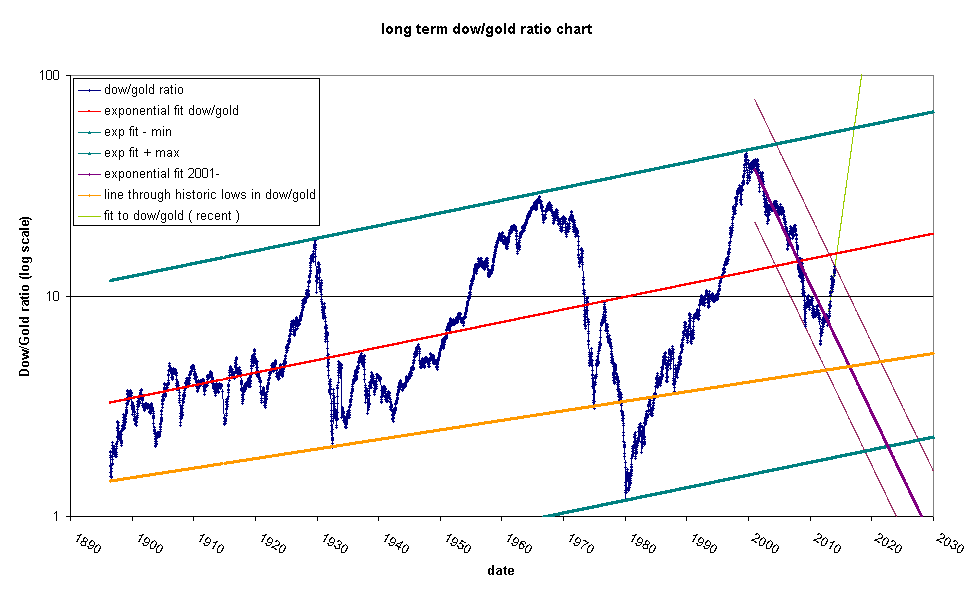
This is the Dow/Gold ratio chart:

This is weekly average data on gold and the Dow Jones industrial
average. The red line is an exponential fit to the data. The dark
green lines are parallel and pass through respectively, the max and
min deviation in percentage terms from the red line. The orange
line is an interesting straight line through some of the historic
lows in the chart (but not through the all time low in 1980). I
have also highlighted some recent action with the lime green and
purple lines.
Note how, in general, stocks seem to be moving upwards relative to
gold over a century long period. This happened even when the US was
on the gold standard (up until 1933). In addition it is worth
noting that the tops of those big bumps form a nice straight line.
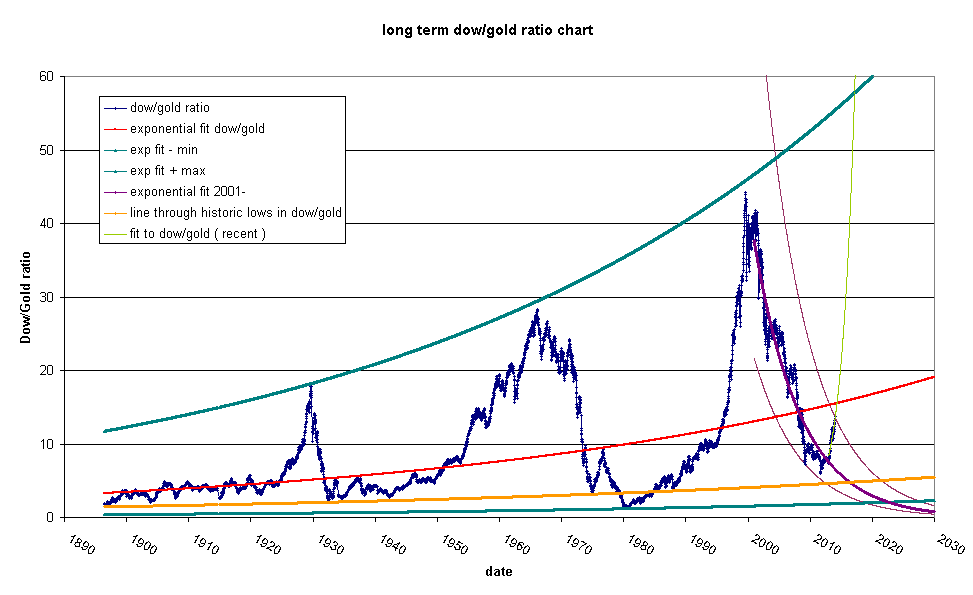
There is a tiny gap between the green line and the tops of the last
two bumps. You can see it more clearly here:

This indicates that the red line is pointing up too high about one
or two degrees. Keep this in mind when we look at the short term
moves.
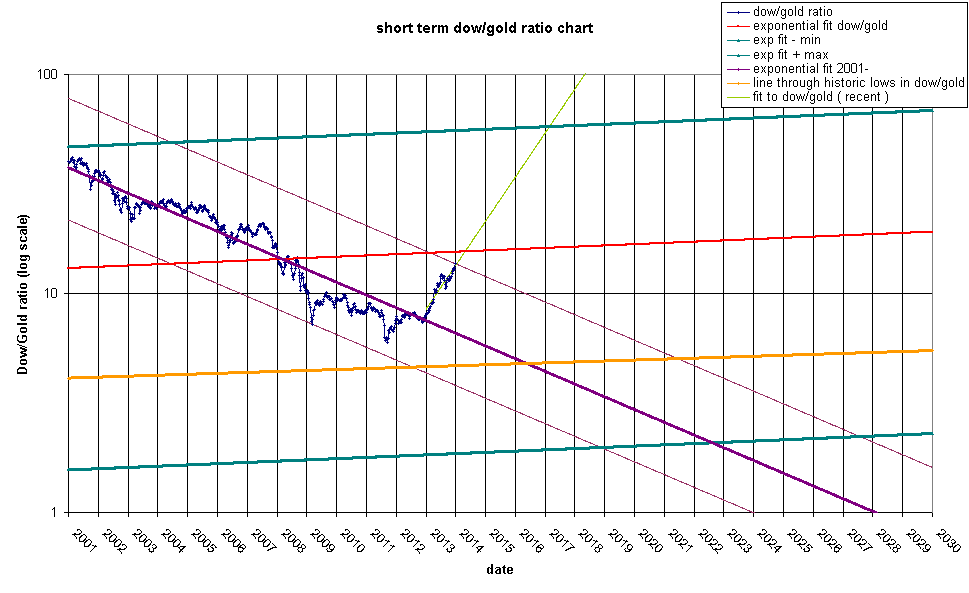
Now let's look at the short term:

What do we see here? The Dow/Gold ratio will hit the red line in
April-May 2014 time frame. It might or might not bounce. If it
fails to bounce at the red line, it will continue on to the top
line and most likely will bounce in 2017. The purple line is
looking very good still and I expect a bounce in April 2014. The
bottom will be between 2019 and 2027 with a most likely bottom in
2022 at a ratio of 2 or so. Another possibility is that the bottom
happens at the orange line between 2016 and 2021 at a ratio of
about 4.6-5.0
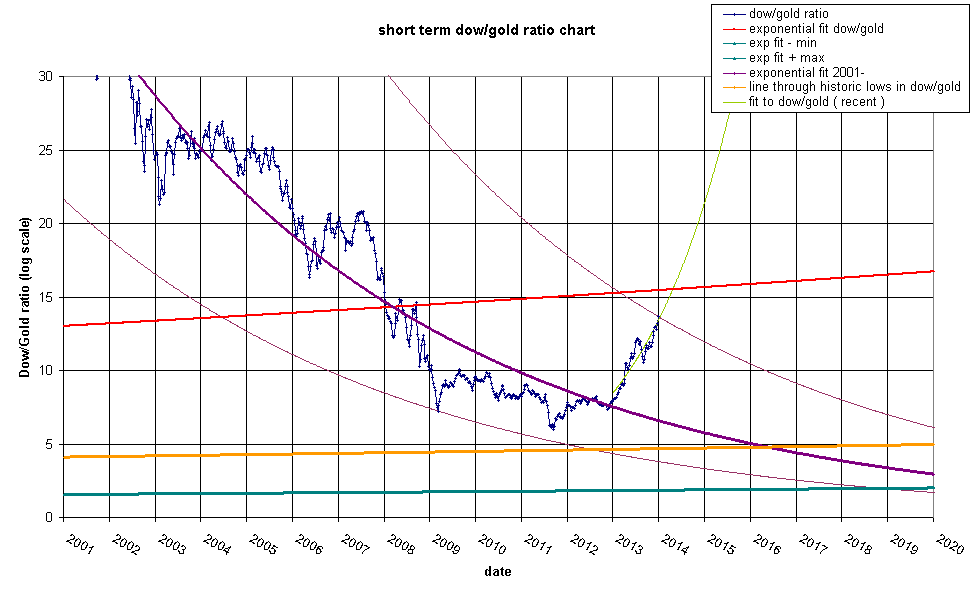
Same view with a linear scale:

The lime green line hits the red line at a ratio of ~15.9 or if
gold hits 1050 we will see a Dow of 16700. If gold stays near 1200
we would see a Dow of 19080. In light of the fact that the new Fed
chairwoman will be seated at that time, I foresee a market crash
and a more likely scenario is 14,000 Dow and $880/oz gold. This
would be a roughly 50% retrace of gold and represent a
capitulation.
Bear in mind that the red line is a tad too high. If we assume that
the intersection of the lime green line and the red line should be
at about a ratio of 15, then it will most likely happen in February
2014. This is coincidentally when Janette Yellen takes the helm of
the most powerful bank in the world.
Bon Voyage!


